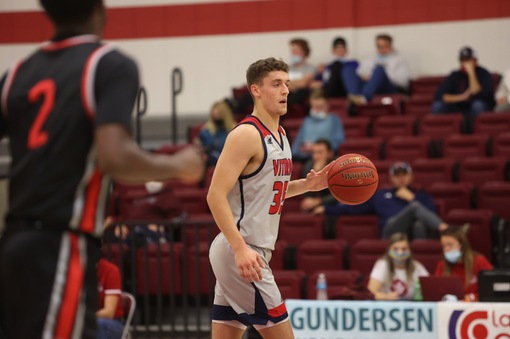
31 Nolan Martin

-
- Height:
- 6-2
-
- Year:
- Jr
-
- Hometown:
- Arcadia, Wis.
-
- High School:
- Arcadia HS
-
- Position:
- G
-
- gp
- 30
-
- pts/g
- 5.6
-
- fg %
- 37.4
-
- 3pt %
- 27.5
-
- ft %
- 63.2
-
- reb/g
- 3.1
-
- a/g
- 1.2
Bio
2021-2022 (Junior):
- Appeared and started in all 30 games for the V-hawks, averaging 20.1 minutes per game
- Shot 37.4 percent from the field
- Scored 168 points on the season, averaging 5.6 points per game
- Grabbed 93 rebounds and 27 steals
- Added 36 assists on the year
- Had a career night vs Waldord on December 4th scoring 15 points on the evening
2020-2021 (Sophomore):
- Appeared in all 19 games for the V-Hawks
- Scored 49 points on the season
- Collected 34 rebounds and nine assists on the year
- Had a career-game on January 23rd vs Dakota State, scoring 10 points and grabbing three rebounds
2019-2020 (Freshman):
- Appeared in 22 games on the season for the V-Hawks
- Scored 57 points on the year
- Contributed 22 rebounds and seven assists
2018-2019: Redshirted
Club: The Wisconsin Playmakers
High School:
- Four-year letter winner as a member of the basketball team at Arcadia High School
- x3 All-Conference Award winner
- x2 Team Captain
- Named to the Academic All-State Team for basketball
- Earned one letter as a member of the track team
Personal:
- Parents are Anne and CJ Martin
- Majoring in Finance
- Why Viterbo?- I chose Viterbo because of the welcoming community and the opportunity they give you to let you thrive.
Player Profile
| Overall | Conf | |||
|---|---|---|---|---|
| Games | 30 | 14 | ||
| Games started | 30 | 14 | ||
| Minutes | 604 | 265 | ||
| Minutes per game | 20.1 | 18.9 | ||
| FG | 61-163 | 22-64 | ||
| FG Pct | 37.4 | 34.4 | ||
| 3PT | 22-80 | 5-28 | ||
| 3PT Pct | 27.5 | 17.9 | ||
| FT | 24-38 | 12-20 | ||
| FT Pct | 63.2 | 60.0 | ||
| Off rebounds | 26 | 14 | ||
| Def rebounds | 67 | 36 | ||
| Total rebounds | 93 | 50 | ||
| Rebounds per game | 3.1 | 3.6 | ||
| Personal fouls | 61 | 23 | ||
| Disqualifications | 1 | - | ||
| Assists | 36 | 17 | ||
| Turnovers | 24 | 16 | ||
| Assist to turnover ratio | 1.5 | 1.1 | ||
| Steals | 27 | 13 | ||
| Blocks | 0 | 0 | ||
| Points | 168 | 61 | ||
| Points per game | 5.6 | 4.4 | ||
| Points per 40 min | 11.1 | 9.2 | ||
Game Log - Shooting
| Date | Opponent | Score | gs | min | fg | pct | 3pt | pct | ft | pct | pts |
|---|---|---|---|---|---|---|---|---|---|---|---|
| Oct 30 | Marian (Wis.) | W, 81-73 | 1 | 24 | 3-6 | 50.0 | 1-4 | 25.0 | 0-0 | - | 7 |
| Nov 6 | Grand View | W, 82-79 | 1 | 28 | 3-7 | 42.9 | 1-4 | 25.0 | 4-5 | 80.0 | 11 |
| Nov 9 | Edgewood College | W, 80-68 | 1 | 26 | 4-10 | 40.0 | 0-4 | 0.0 | 2-3 | 66.7 | 10 |
| Nov 12 | at Northwestern | L, 96-83 | 1 | 20 | 7-11 | 63.6 | 5-7 | 71.4 | 0-0 | - | 19 |
| Nov 13 | vs. Dordt | L, 100-51 | 1 | 25 | 1-6 | 16.7 | 0-3 | 0.0 | 0-0 | - | 2 |
| Nov 17 | at Winona State | L, 84-56 | - | - | - | - | - | - | - | - | - |
| Nov 19 | Cardinal Stritch | L, 79-77 | 1 | 20 | 1-2 | 50.0 | 0-1 | 0.0 | 2-2 | 100.0 | 4 |
| Nov 20 | College of the Ozarks | L, 76-64 | 1 | 16 | 1-6 | 16.7 | 0-4 | 0.0 | 0-0 | - | 2 |
| Nov 23 | Wis.-Whitewater | W, 86-77 | 1 | 31 | 2-6 | 33.3 | 1-4 | 25.0 | 0-0 | - | 5 |
| Dec 4 | at Waldorf | L, 75-68 | 1 | 26 | 4-12 | 33.3 | 2-8 | 25.0 | 5-7 | 71.4 | 15 |
| Dec 8 | at Olivet Nazarene | L, 89-70 | 1 | 16 | 2-4 | 50.0 | 1-2 | 50.0 | 1-2 | 50.0 | 6 |
| Dec 11 | Mount Mercy | W, 88-69 | 1 | 15 | 2-2 | 100.0 | 1-1 | 100.0 | 0-0 | - | 5 |
| Dec 18 | Northwestern | L, 80-66 | 1 | 22 | 1-6 | 16.7 | 1-4 | 25.0 | 0-0 | - | 3 |
| Dec 20 | at Mount Mercy | L, 94-85 | 1 | 22 | 2-7 | 28.6 | 1-2 | 50.0 | 0-1 | 0.0 | 5 |
| Dec 30 | at Milwaukee School of Engineering | W, 61-58 | 1 | 13 | 1-6 | 16.7 | 0-0 | - | 0-0 | - | 2 |
| Jan 7 | at Presentation | W, 79-68 | 1 | 20 | 2-8 | 25.0 | 0-2 | 0.0 | 0-0 | - | 4 |
| Jan 8 | at Mayville State | W, 63-60 | 1 | 20 | 2-7 | 28.6 | 0-2 | 0.0 | 0-0 | - | 4 |
| Jan 14 | Valley City State | W, 84-70 | 1 | 23 | 1-2 | 50.0 | 0-1 | 0.0 | 1-1 | 100.0 | 3 |
| Jan 15 | Dickinson State | L, 84-71 | 1 | 18 | 1-2 | 50.0 | 1-2 | 50.0 | 0-0 | - | 3 |
| Jan 21 | at Bellevue | W, 67-63 | 1 | 19 | 1-8 | 12.5 | 0-1 | 0.0 | 0-0 | - | 2 |
| Jan 22 | at Dakota State | W, 68-67 | 1 | 21 | 1-3 | 33.3 | 0-2 | 0.0 | 1-2 | 50.0 | 3 |
| Jan 28 | Dakota State | L, 70-65 | 1 | 20 | 0-2 | 0.0 | 0-1 | 0.0 | 2-2 | 100.0 | 2 |
| Jan 29 | Bellevue | L, 59-53 | 1 | 15 | 0-2 | 0.0 | 0-2 | 0.0 | 0-0 | - | 0 |
| Feb 4 | at Dickinson State | W, 63-61 | 1 | 1 | 2-4 | 50.0 | 0-3 | 0.0 | 1-2 | 50.0 | 5 |
| Feb 5 | at Valley City State | W, 89-66 | 1 | 21 | 1-1 | 100.0 | 0-0 | - | 0-0 | - | 2 |
| Feb 11 | Mayville State | W, 67-65 | 1 | 22 | 3-5 | 60.0 | 1-2 | 50.0 | 0-1 | 0.0 | 7 |
| Feb 12 | Presentation | L, 76-68 | 1 | 17 | 2-3 | 66.7 | 1-2 | 50.0 | 0-1 | 0.0 | 5 |
| Feb 18 | Waldorf | W, 97-66 | 1 | 22 | 2-5 | 40.0 | 0-0 | - | 2-4 | 50.0 | 6 |
| Feb 23 | Waldorf | W, 74-72 | 1 | 24 | 4-9 | 44.4 | 3-7 | 42.9 | 1-2 | 50.0 | 12 |
| Feb 26 | vs. Dakota State | W, 75-73 | 1 | 17 | 2-4 | 50.0 | 0-2 | 0.0 | 0-1 | 0.0 | 4 |
| Feb 27 | vs. Bellevue | L, 69-65 | 1 | 20 | 3-7 | 42.9 | 2-3 | 66.7 | 2-2 | 100.0 | 10 |
Game Log - Ball control
| Date | Opponent | Score | gs | min | off | def | reb | ast | to | a/to | stl | blk | pf | dq |
|---|---|---|---|---|---|---|---|---|---|---|---|---|---|---|
| Oct 30 | Marian (Wis.) | W, 81-73 | 1 | 24 | 1 | 1 | 2 | 4 | 0 | - | 1 | 0 | 1 | - |
| Nov 6 | Grand View | W, 82-79 | 1 | 28 | 0 | 3 | 3 | 2 | 1 | 2.0 | 0 | 0 | 1 | - |
| Nov 9 | Edgewood College | W, 80-68 | 1 | 26 | 1 | 3 | 4 | 1 | 1 | 1.0 | 1 | 0 | 3 | - |
| Nov 12 | at Northwestern | L, 96-83 | 1 | 20 | 0 | 4 | 4 | 0 | 0 | - | 1 | 0 | 3 | - |
| Nov 13 | vs. Dordt | L, 100-51 | 1 | 25 | 0 | 3 | 3 | 1 | 0 | - | 2 | 0 | 2 | - |
| Nov 17 | at Winona State | L, 84-56 | - | - | - | - | - | - | - | - | - | - | - | - |
| Nov 19 | Cardinal Stritch | L, 79-77 | 1 | 20 | 1 | 1 | 2 | 1 | 0 | - | 0 | 0 | 1 | - |
| Nov 20 | College of the Ozarks | L, 76-64 | 1 | 16 | 0 | 3 | 3 | 0 | 0 | - | 0 | 0 | 3 | - |
| Nov 23 | Wis.-Whitewater | W, 86-77 | 1 | 31 | 2 | 2 | 4 | 3 | 1 | 3.0 | 1 | 0 | 2 | - |
| Dec 4 | at Waldorf | L, 75-68 | 1 | 26 | 2 | 2 | 4 | 0 | 2 | 0.0 | 1 | 0 | 1 | - |
| Dec 8 | at Olivet Nazarene | L, 89-70 | 1 | 16 | 0 | 1 | 1 | 1 | 0 | - | 1 | 0 | 3 | - |
| Dec 11 | Mount Mercy | W, 88-69 | 1 | 15 | 0 | 1 | 1 | 2 | 1 | 2.0 | 1 | 0 | 4 | - |
| Dec 18 | Northwestern | L, 80-66 | 1 | 22 | 1 | 2 | 3 | 2 | 0 | - | 1 | 0 | 1 | - |
| Dec 20 | at Mount Mercy | L, 94-85 | 1 | 22 | 0 | 1 | 1 | 1 | 0 | - | 2 | 0 | 4 | - |
| Dec 30 | at Milwaukee School of Engineering | W, 61-58 | 1 | 13 | 2 | 0 | 2 | 0 | 3 | 0.0 | 2 | 0 | 5 | 1 |
| Jan 7 | at Presentation | W, 79-68 | 1 | 20 | 3 | 2 | 5 | 1 | 4 | 0.3 | 1 | 0 | 1 | - |
| Jan 8 | at Mayville State | W, 63-60 | 1 | 20 | 1 | 0 | 1 | 0 | 0 | - | 1 | 0 | 1 | - |
| Jan 14 | Valley City State | W, 84-70 | 1 | 23 | 0 | 4 | 4 | 1 | 0 | - | 2 | 0 | 1 | - |
| Jan 15 | Dickinson State | L, 84-71 | 1 | 18 | 2 | 1 | 3 | 2 | 1 | 2.0 | 2 | 0 | 1 | - |
| Jan 21 | at Bellevue | W, 67-63 | 1 | 19 | 0 | 2 | 2 | 2 | 0 | - | 1 | 0 | 1 | - |
| Jan 22 | at Dakota State | W, 68-67 | 1 | 21 | 0 | 3 | 3 | 2 | 0 | - | 0 | 0 | 4 | - |
| Jan 28 | Dakota State | L, 70-65 | 1 | 20 | 1 | 4 | 5 | 2 | 0 | - | 1 | 0 | 3 | - |
| Jan 29 | Bellevue | L, 59-53 | 1 | 15 | 0 | 2 | 2 | 1 | 2 | 0.5 | 0 | 0 | 3 | - |
| Feb 4 | at Dickinson State | W, 63-61 | 1 | 1 | 0 | 3 | 3 | 2 | 2 | 1.0 | 0 | 0 | 1 | - |
| Feb 5 | at Valley City State | W, 89-66 | 1 | 21 | 0 | 4 | 4 | 0 | 0 | - | 1 | 0 | 3 | - |
| Feb 11 | Mayville State | W, 67-65 | 1 | 22 | 2 | 3 | 5 | 2 | 1 | 2.0 | 1 | 0 | 0 | - |
| Feb 12 | Presentation | L, 76-68 | 1 | 17 | 1 | 4 | 5 | 1 | 4 | 0.3 | 0 | 0 | 2 | - |
| Feb 18 | Waldorf | W, 97-66 | 1 | 22 | 2 | 2 | 4 | 1 | 0 | - | 2 | 0 | 1 | - |
| Feb 23 | Waldorf | W, 74-72 | 1 | 24 | 0 | 1 | 1 | 1 | 0 | - | 1 | 0 | 3 | - |
| Feb 26 | vs. Dakota State | W, 75-73 | 1 | 17 | 2 | 1 | 3 | 0 | 0 | - | 0 | 0 | 1 | - |
| Feb 27 | vs. Bellevue | L, 69-65 | 1 | 20 | 2 | 4 | 6 | 0 | 1 | 0.0 | 0 | 0 | 1 | - |
Career Stats - Shooting per game
| gp | gs | min/g | fg/g | pct | 3pt/g | pct | ft/g | pct | ppg | |
|---|---|---|---|---|---|---|---|---|---|---|
| 2018-19 | - | - | - | 0.0-0.0 | - | 0.0-0.0 | - | 0.0-0.0 | - | - |
| 2019-20 | 20 | 0 | 7.6 | 0.8-2.4 | 33.3 | 0.5-1.6 | 29.0 | 0.5-0.8 | 60.0 | 2.5 |
| 2020-21 | 18 | 0 | 11.0 | 0.9-2.8 | 34.0 | 0.4-1.7 | 25.8 | 0.4-0.8 | 50.0 | 2.7 |
| 2021-22 | 30 | 30 | 20.1 | 2.0-5.4 | 37.4 | 0.7-2.7 | 27.5 | 0.8-1.3 | 63.2 | 5.6 |
| Total | 68 | 30 | 14.0 | 1.4-3.8 | 36.0 | 0.6-2.1 | 27.5 | 0.6-1.0 | 59.7 | 3.9 |
Career Stats - Shooting totals
Career Stats - Shooting per 40 min
| gp | gs | min/g | fg/40 | pct | 3pt/40 | pct | ft/40 | pct | pts/40 | |
|---|---|---|---|---|---|---|---|---|---|---|
| 2018-19 | - | - | - | 0.0-0.0 | - | 0.0-0.0 | - | 0.0-0.0 | - | - |
| 2019-20 | 20 | 0 | 7.6 | 4.2-12.6 | 33.3 | 2.4-8.2 | 29.0 | 2.4-3.9 | 60.0 | 13.2 |
| 2020-21 | 18 | 0 | 11.0 | 3.4-10.1 | 34.0 | 1.6-6.3 | 25.8 | 1.4-2.8 | 50.0 | 9.9 |
| 2021-22 | 30 | 30 | 20.1 | 4.0-10.8 | 37.4 | 1.5-5.3 | 27.5 | 1.6-2.5 | 63.2 | 11.1 |
| Total | 68 | 30 | 14.0 | 3.9-10.9 | 36.0 | 1.6-6.0 | 27.5 | 1.7-2.8 | 59.7 | 11.2 |
Career Stats - Ball control per game
| gp | gs | mpg | off/g | def/g | reb/g | pf/g | dq/g | ast/g | to/g | a/to | stl/g | blk/g | |
|---|---|---|---|---|---|---|---|---|---|---|---|---|---|
| 2018-19 | - | - | - | - | - | - | - | - | - | - | - | - | - |
| 2019-20 | 20 | 0 | 7.6 | 0.3 | 0.7 | 0.9 | 0.7 | - | 0.3 | 0.3 | 1.2 | 0.3 | 0.1 |
| 2020-21 | 18 | 0 | 11.0 | 0.7 | 1.1 | 1.8 | 1.5 | - | 0.4 | 0.6 | 0.8 | 0.8 | 0.1 |
| 2021-22 | 30 | 30 | 20.1 | 0.9 | 2.2 | 3.1 | 2.0 | 0.0 | 1.2 | 0.8 | 1.5 | 0.9 | 0.0 |
| Total | 68 | 30 | 14.0 | 0.7 | 1.5 | 2.1 | 1.5 | 0.0 | 0.7 | 0.6 | 1.3 | 0.7 | 0.0 |
Career Stats - Ball control per 40 min
| gp | gs | mpg | off/40 | def/40 | reb/40 | pf/40 | dq/40 | ast/40 | to/40 | a/to | stl/40 | blk/40 | |
|---|---|---|---|---|---|---|---|---|---|---|---|---|---|
| 2018-19 | - | - | - | - | - | - | - | - | - | - | - | - | - |
| 2019-20 | 20 | 0 | 7.6 | 1.6 | 3.4 | 5.0 | 3.7 | 0.0 | 1.6 | 1.3 | 1.2 | 1.6 | 0.3 |
| 2020-21 | 18 | 0 | 11.0 | 2.6 | 4.0 | 6.7 | 5.5 | 0.0 | 1.6 | 2.0 | 0.8 | 2.8 | 0.4 |
| 2021-22 | 30 | 30 | 20.1 | 1.7 | 4.4 | 6.2 | 4.0 | 0.1 | 2.4 | 1.6 | 1.5 | 1.8 | 0.0 |
| Total | 68 | 30 | 14.0 | 1.9 | 4.2 | 6.1 | 4.3 | 0.0 | 2.1 | 1.6 | 1.3 | 2.0 | 0.1 |
Splits Stats - Shooting per game
| gp | gs | min/g | fg/g | pct | 3pt/g | pct | ft/g | pct | ppg | ||
|---|---|---|---|---|---|---|---|---|---|---|---|
| Event | Total | 30 | 30 | 20.1 | 2.0-5.4 | 37.4 | 0.7-2.7 | 27.5 | 0.8-1.3 | 63.2 | 5.6 |
| Conference | 14 | 14 | 18.9 | 1.6-4.6 | 34.4 | 0.4-2.0 | 17.9 | 0.9-1.4 | 60.0 | 4.4 | |
| Exhibition | - | - | - | 0.0-0.0 | - | 0.0-0.0 | - | 0.0-0.0 | - | - | |
| Location | Home | 16 | 16 | 21.4 | 1.9-4.7 | 40.0 | 0.7-2.7 | 25.6 | 0.9-1.3 | 66.7 | 5.3 |
| Away | 11 | 11 | 18.1 | 2.3-6.5 | 35.2 | 0.8-2.6 | 31.0 | 0.7-1.3 | 57.1 | 6.1 | |
| Neutral | 3 | 3 | 20.7 | 2.0-5.7 | 35.3 | 0.7-2.7 | 25.0 | 0.7-1.0 | 66.7 | 5.3 | |
| Result | Wins | 17 | 17 | 20.4 | 2.1-5.5 | 38.7 | 0.5-2.3 | 20.5 | 0.7-1.2 | 57.1 | 5.4 |
| Losses | 13 | 13 | 19.8 | 1.9-5.4 | 35.7 | 1.1-3.2 | 34.1 | 0.9-1.3 | 70.6 | 5.8 | |
| Month | October | 1 | 1 | 24.0 | 3.0-6.0 | 50.0 | 1.0-4.0 | 25.0 | 0.0-0.0 | - | 7.0 |
| November | 7 | 7 | 23.7 | 2.7-6.9 | 39.6 | 1.0-3.9 | 25.9 | 1.1-1.4 | 80.0 | 7.6 | |
| December | 6 | 6 | 19.0 | 2.0-6.2 | 32.4 | 1.0-2.8 | 35.3 | 1.0-1.7 | 60.0 | 6.0 | |
| January | 8 | 8 | 19.5 | 1.0-4.2 | 23.5 | 0.1-1.6 | 7.7 | 0.5-0.6 | 80.0 | 2.6 | |
| February | 8 | 8 | 18.0 | 2.4-4.8 | 50.0 | 0.9-2.4 | 36.8 | 0.8-1.6 | 46.2 | 6.4 |
Splits Stats - Shooting totals
| gp | gs | min | fg | pct | 3pt | pct | ft | pct | pts | ||
|---|---|---|---|---|---|---|---|---|---|---|---|
| Event | Total | 30 | 30 | 604 | 61-163 | 37.4 | 22-80 | 27.5 | 24-38 | 63.2 | 168 |
| Conference | 14 | 14 | 265 | 22-64 | 34.4 | 5-28 | 17.9 | 12-20 | 60.0 | 61 | |
| Exhibition | - | - | - | 0-0 | - | 0-0 | - | 0-0 | - | 0 | |
| Location | Home | 16 | 16 | 343 | 30-75 | 40.0 | 11-43 | 25.6 | 14-21 | 66.7 | 85 |
| Away | 11 | 11 | 199 | 25-71 | 35.2 | 9-29 | 31.0 | 8-14 | 57.1 | 67 | |
| Neutral | 3 | 3 | 62 | 6-17 | 35.3 | 2-8 | 25.0 | 2-3 | 66.7 | 16 | |
| Result | Wins | 17 | 17 | 347 | 36-93 | 38.7 | 8-39 | 20.5 | 12-21 | 57.1 | 92 |
| Losses | 13 | 13 | 257 | 25-70 | 35.7 | 14-41 | 34.1 | 12-17 | 70.6 | 76 | |
| Month | October | 1 | 1 | 24 | 3-6 | 50.0 | 1-4 | 25.0 | 0-0 | - | 7 |
| November | 7 | 7 | 166 | 19-48 | 39.6 | 7-27 | 25.9 | 8-10 | 80.0 | 53 | |
| December | 6 | 6 | 114 | 12-37 | 32.4 | 6-17 | 35.3 | 6-10 | 60.0 | 36 | |
| January | 8 | 8 | 156 | 8-34 | 23.5 | 1-13 | 7.7 | 4-5 | 80.0 | 21 | |
| February | 8 | 8 | 144 | 19-38 | 50.0 | 7-19 | 36.8 | 6-13 | 46.2 | 51 |
Splits Stats - Shooting per 40 min
| gp | gs | min/g | fg/40 | pct | 3pt/40 | pct | ft/40 | pct | pts/40 | ||
|---|---|---|---|---|---|---|---|---|---|---|---|
| Event | Total | 30 | 30 | 20.1 | 4.0-10.8 | 37.4 | 1.5-5.3 | 27.5 | 1.6-2.5 | 63.2 | 11.1 |
| Conference | 14 | 14 | 18.9 | 3.3-9.7 | 34.4 | 0.8-4.2 | 17.9 | 1.8-3.0 | 60.0 | 9.2 | |
| Exhibition | - | - | - | 0.0-0.0 | - | 0.0-0.0 | - | 0.0-0.0 | - | - | |
| Location | Home | 16 | 16 | 21.4 | 3.5-8.7 | 40.0 | 1.3-5.0 | 25.6 | 1.6-2.4 | 66.7 | 9.9 |
| Away | 11 | 11 | 18.1 | 5.0-14.3 | 35.2 | 1.8-5.8 | 31.0 | 1.6-2.8 | 57.1 | 13.5 | |
| Neutral | 3 | 3 | 20.7 | 3.9-11.0 | 35.3 | 1.3-5.2 | 25.0 | 1.3-1.9 | 66.7 | 10.3 | |
| Result | Wins | 17 | 17 | 20.4 | 4.1-10.7 | 38.7 | 0.9-4.5 | 20.5 | 1.4-2.4 | 57.1 | 10.6 |
| Losses | 13 | 13 | 19.8 | 3.9-10.9 | 35.7 | 2.2-6.4 | 34.1 | 1.9-2.6 | 70.6 | 11.8 | |
| Month | October | 1 | 1 | 24.0 | 5.0-10.0 | 50.0 | 1.7-6.7 | 25.0 | 0.0-0.0 | - | 11.7 |
| November | 7 | 7 | 23.7 | 4.6-11.6 | 39.6 | 1.7-6.5 | 25.9 | 1.9-2.4 | 80.0 | 12.8 | |
| December | 6 | 6 | 19.0 | 4.2-13.0 | 32.4 | 2.1-6.0 | 35.3 | 2.1-3.5 | 60.0 | 12.6 | |
| January | 8 | 8 | 19.5 | 2.1-8.7 | 23.5 | 0.3-3.3 | 7.7 | 1.0-1.3 | 80.0 | 5.4 | |
| February | 8 | 8 | 18.0 | 5.3-10.6 | 50.0 | 1.9-5.3 | 36.8 | 1.7-3.6 | 46.2 | 14.2 |
Splits Stats - Ball control per game
| gp | gs | mpg | off/g | def/g | reb/g | pf/g | dq/g | ast/g | to/g | a/to | stl/g | blk/g | ||
|---|---|---|---|---|---|---|---|---|---|---|---|---|---|---|
| Event | Total | 30 | 30 | 20.1 | 0.9 | 2.2 | 3.1 | 2.0 | 0.0 | 1.2 | 0.8 | 1.5 | 0.9 | 0.0 |
| Conference | 14 | 14 | 18.9 | 1.0 | 2.6 | 3.6 | 1.6 | - | 1.2 | 1.1 | 1.1 | 0.9 | 0.0 | |
| Exhibition | - | - | - | - | - | - | - | - | - | - | - | - | - | |
| Location | Home | 16 | 16 | 21.4 | 0.9 | 2.3 | 3.2 | 1.9 | - | 1.6 | 0.8 | 2.2 | 0.9 | 0.0 |
| Away | 11 | 11 | 18.1 | 0.7 | 2.0 | 2.7 | 2.5 | 0.1 | 0.8 | 1.0 | 0.8 | 1.0 | 0.0 | |
| Neutral | 3 | 3 | 20.7 | 1.3 | 2.7 | 4.0 | 1.3 | - | 0.3 | 0.3 | 1.0 | 0.7 | 0.0 | |
| Result | Wins | 17 | 17 | 20.4 | 0.9 | 2.1 | 3.0 | 1.9 | 0.1 | 1.4 | 0.8 | 1.7 | 0.9 | 0.0 |
| Losses | 13 | 13 | 19.8 | 0.8 | 2.5 | 3.2 | 2.2 | - | 0.9 | 0.8 | 1.2 | 0.8 | 0.0 | |
| Month | October | 1 | 1 | 24.0 | 1.0 | 1.0 | 2.0 | 1.0 | - | 4.0 | 0.0 | - | 1.0 | 0.0 |
| November | 7 | 7 | 23.7 | 0.6 | 2.7 | 3.3 | 2.1 | - | 1.1 | 0.4 | 2.7 | 0.7 | 0.0 | |
| December | 6 | 6 | 19.0 | 0.8 | 1.2 | 2.0 | 3.0 | 0.2 | 1.0 | 1.0 | 1.0 | 1.3 | 0.0 | |
| January | 8 | 8 | 19.5 | 0.9 | 2.3 | 3.1 | 1.9 | - | 1.4 | 0.9 | 1.6 | 1.0 | 0.0 | |
| February | 8 | 8 | 18.0 | 1.1 | 2.8 | 3.9 | 1.5 | - | 0.9 | 1.0 | 0.9 | 0.6 | 0.0 |
Splits Stats - Ball control totals
| gp | gs | min | off | def | reb | pf | dq | ast | to | a/to | stl | blk | ||
|---|---|---|---|---|---|---|---|---|---|---|---|---|---|---|
| Event | Total | 30 | 30 | 604 | 26 | 67 | 93 | 61 | 1 | 36 | 24 | 1.5 | 27 | 0 |
| Conference | 14 | 14 | 265 | 14 | 36 | 50 | 23 | - | 17 | 16 | 1.1 | 13 | 0 | |
| Exhibition | - | - | - | - | - | - | - | - | - | - | - | - | - | |
| Location | Home | 16 | 16 | 343 | 14 | 37 | 51 | 30 | - | 26 | 12 | 2.2 | 14 | 0 |
| Away | 11 | 11 | 199 | 8 | 22 | 30 | 27 | 1 | 9 | 11 | 0.8 | 11 | 0 | |
| Neutral | 3 | 3 | 62 | 4 | 8 | 12 | 4 | - | 1 | 1 | 1.0 | 2 | 0 | |
| Result | Wins | 17 | 17 | 347 | 16 | 35 | 51 | 33 | 1 | 24 | 14 | 1.7 | 16 | 0 |
| Losses | 13 | 13 | 257 | 10 | 32 | 42 | 28 | - | 12 | 10 | 1.2 | 11 | 0 | |
| Month | October | 1 | 1 | 24 | 1 | 1 | 2 | 1 | - | 4 | 0 | - | 1 | 0 |
| November | 7 | 7 | 166 | 4 | 19 | 23 | 15 | - | 8 | 3 | 2.7 | 5 | 0 | |
| December | 6 | 6 | 114 | 5 | 7 | 12 | 18 | 1 | 6 | 6 | 1.0 | 8 | 0 | |
| January | 8 | 8 | 156 | 7 | 18 | 25 | 15 | - | 11 | 7 | 1.6 | 8 | 0 | |
| February | 8 | 8 | 144 | 9 | 22 | 31 | 12 | - | 7 | 8 | 0.9 | 5 | 0 |
Splits Stats - Ball control per 40 min
| gp | gs | mpg | off/40 | def/40 | reb/40 | pf/40 | dq/40 | ast/40 | to/40 | a/to | stl/40 | blk/40 | ||
|---|---|---|---|---|---|---|---|---|---|---|---|---|---|---|
| Event | Total | 30 | 30 | 20.1 | 1.7 | 4.4 | 6.2 | 4.0 | 0.1 | 2.4 | 1.6 | 1.5 | 1.8 | 0.0 |
| Conference | 14 | 14 | 18.9 | 2.1 | 5.4 | 7.5 | 3.5 | 0.0 | 2.6 | 2.4 | 1.1 | 2.0 | 0.0 | |
| Exhibition | - | - | - | - | - | - | - | - | - | - | - | - | - | |
| Location | Home | 16 | 16 | 21.4 | 1.6 | 4.3 | 5.9 | 3.5 | 0.0 | 3.0 | 1.4 | 2.2 | 1.6 | 0.0 |
| Away | 11 | 11 | 18.1 | 1.6 | 4.4 | 6.0 | 5.4 | 0.2 | 1.8 | 2.2 | 0.8 | 2.2 | 0.0 | |
| Neutral | 3 | 3 | 20.7 | 2.6 | 5.2 | 7.7 | 2.6 | 0.0 | 0.6 | 0.6 | 1.0 | 1.3 | 0.0 | |
| Result | Wins | 17 | 17 | 20.4 | 1.8 | 4.0 | 5.9 | 3.8 | 0.1 | 2.8 | 1.6 | 1.7 | 1.8 | 0.0 |
| Losses | 13 | 13 | 19.8 | 1.6 | 5.0 | 6.5 | 4.4 | 0.0 | 1.9 | 1.6 | 1.2 | 1.7 | 0.0 | |
| Month | October | 1 | 1 | 24.0 | 1.7 | 1.7 | 3.3 | 1.7 | 0.0 | 6.7 | 0.0 | - | 1.7 | 0.0 |
| November | 7 | 7 | 23.7 | 1.0 | 4.6 | 5.5 | 3.6 | 0.0 | 1.9 | 0.7 | 2.7 | 1.2 | 0.0 | |
| December | 6 | 6 | 19.0 | 1.8 | 2.5 | 4.2 | 6.3 | 0.4 | 2.1 | 2.1 | 1.0 | 2.8 | 0.0 | |
| January | 8 | 8 | 19.5 | 1.8 | 4.6 | 6.4 | 3.8 | 0.0 | 2.8 | 1.8 | 1.6 | 2.1 | 0.0 | |
| February | 8 | 8 | 18.0 | 2.5 | 6.1 | 8.6 | 3.3 | 0.0 | 1.9 | 2.2 | 0.9 | 1.4 | 0.0 |
News Mentions
Men's Basketball season ends in NSAA Championship game
February 27, 2022

Men's Basketball gets huge victory over Mayville State
February 11, 2022
Strong first-half offense leads Men's Basketball to victory
December 11, 2021

Men's basketball drops conference opener at Waldorf
December 5, 2021
Men's Basketball puts up big second half to defeat UW-Whitewater
November 23, 2021

Viterbo makes for exciting 82-79 victory over Grand View
November 7, 2021
Men's Basketball starts off season with win over Marian (Wis.)
October 30, 2021